Subscription Forecasting and Planning
Overview Video
Add Opportunities, Orders and Subscriptions to Forecast
Opportunities and orders can be added to the forecast both manually and automatically.
To add an opportunity manually to a forecast from the opportunity or order page, use the “Add To Subscription Forecast” button and select a forecast and algorithm. Your default forecast and algorithm are pre-selected.

Opportunities with probability = 0% can not be added and if an opportunity is updated to probability 0% it gets removed from the forecast.
Opportunities and Orders can also be added in bulk from the “Multiple At Once” page. You access this page from the bottom section on the Subiterum Setup page.
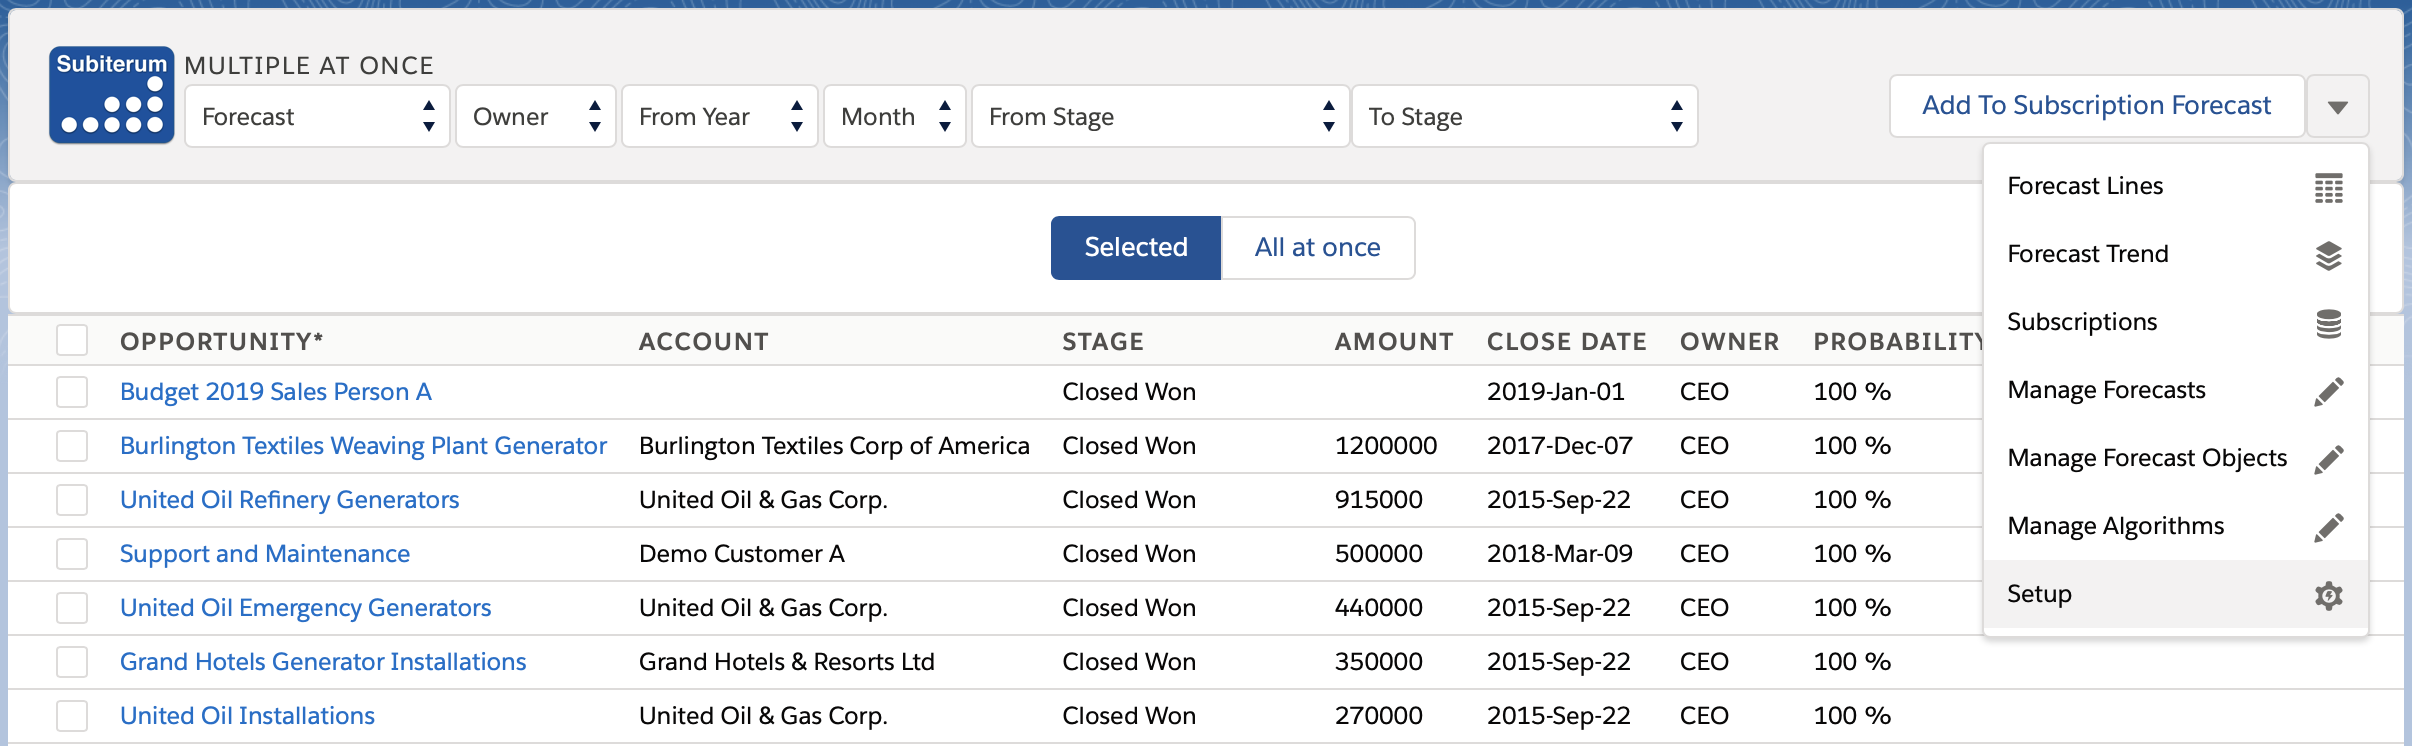
You can filter the search in the top section and then add one or many Opportunities/Orders at once from the results shown on page. Use the “All at once” button if you want to add all Opportunities/Orders meeting the filter criteria in one go. “All at once” processing will run in the background and one complete you will receive an email notification.
Enter and update forecast values manually
Forecast values can be entered and adjusted on the “Forecast Line” page using the edit button on a line.

Values can be changed both individually or multiple at once through the adjustment tools at the bottom section in the pop-up. The decimal granularity in this pop-up is controlled by the FormatInput application setting.
The line level menu provides capabilities to hide/show line, analyze line, remove from forecast and update Opportunity amount.

The menu option “Update Opportunity” is enabled via the application setting UpdateOpportunityAmountFromLine (Yes/No)” and applies to opportunities without products. It does the following:
- summarises the forecasted values for the opportunity across all forecast objects into a summary amount. Actuals are used when present.
- The number of years to summarise from opportunity close date is configurable in the UpdateOpportunityAmountFromLine application setting.
- updates the opportunity amount with the summary amount
Opportunities with products get their total amount from the sum of all products and it is read only. “Update Opportunity” menu option is not displayed for these. Changes made to opportunities with product lines are propagated into forecasted values even when UpdateOpportunityAmountFromLine=Yes.
“Analyze Opportunity” shows the current forecast compared to previous forecasts to show how forecasted values have changed over time.

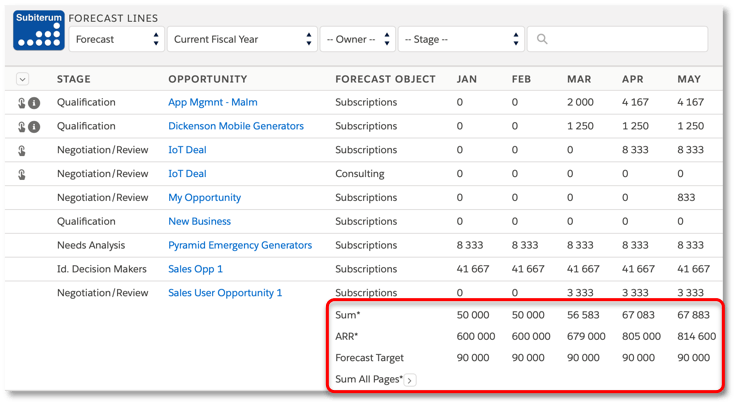
The summary lines on the forecast lines page have the following definitions:
- Sum = summary of values shown on current (actuals used when present)
- ARR = Annual Recurring Revenue summary for current page
- Forecast Target = the forecast target as defined on the forecast
- Sum All Pages = summary forecasted values across all pages
Enter Actuals
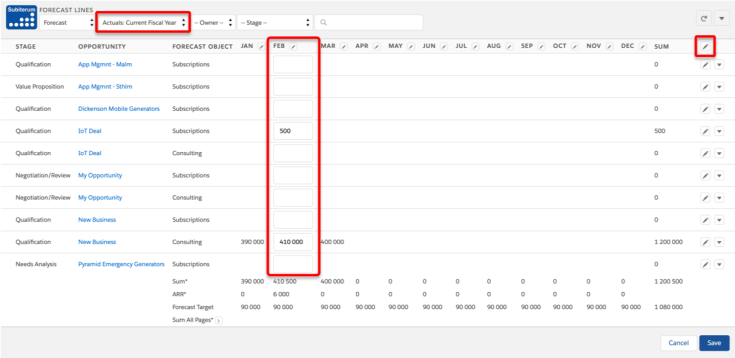
Each forecast line can store “actual” values in addition to the forecasted values. Actual values can be entered by users with permission set “Subscription Forecast Admin” or “Subscription Forecast Edit Actuals”.
Actuals can be entered either line by line using the line level “update” popup or by selecting “Actuals: Current Fiscal Year” to update columns or full grid at once.
Forecast Trending
The Forecast Trend page compares values from current month with values from previous comparison periods.
Forecasted values are copied into historical snapshots on a weekly/monthly/yearly basis depending on configuration (). Snapshots can also be created manually by admins using the button on the Forecast Trend page.
Snapshots from previous periods are kept for one month after which they are deleted except for first snapshot from every month that remains.
Previous period defaults to the most recent historical snapshot and you can manually select any previous period for comparison. You can hide lines from being displayed and users with admin permission can also save a filter for what gets hidden by default. You can toggle between a monthly and quarterly view using the icon at top right corner of table.

- Actual values takes precedence over forecasted values
- Current Period displays values as of now
- Previous Period displays values from the selected previous comparison date
- All Recurring filter in the forecast objects drop down list summaries all values for “Recurring” forecast objects.
- Annual Recurring Revenue shows the monthly recurring revenue normalised to a yearly value by multiplying it with 12.
The thresholds for red and green colors are configurable as application settings.
The underlying data is the same as for Forecast Line page which means a user only sees values for opportunities, orders and subscriptions that are accessible.
Setup and configurations
User Permission Sets
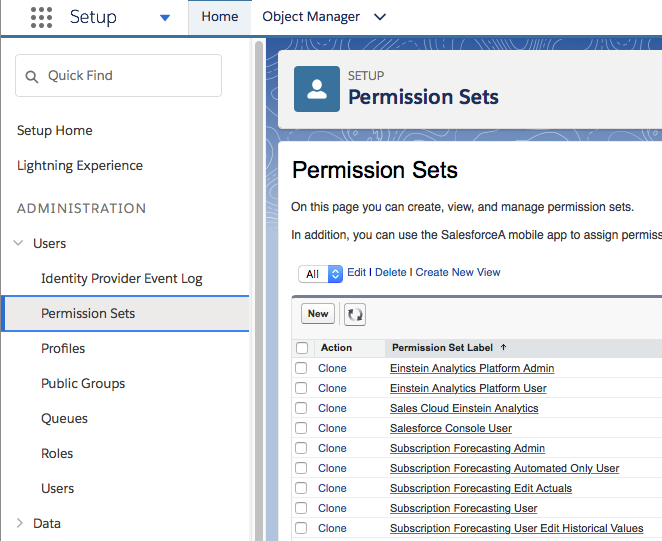
All Salesforce users that should access the application need to have a license assigned and one or more of the below subscription forecasting permission sets.
Licenses are assigned via Setup – Platform Tools – Apps – Installed Packages and then “Manage Licenses”. Permission sets are added from Setup – Administration – Users – Permission Sets:
Subscription Forecasting Admin: Full access to the application in including:
- Define forecasts
- Define forecast objects
- Define algorithms
- Define product mappings
- Can enter forecast values for opportunities and subscriptions
- Can edit historical values
- Can edit actuals
- Can take trend history snapshots and save filter for line hide/show
- Visible user guide links inside the application
Note that this admin permission gives users full access including deletion of forecasts so use it with care.
Subscription Forecasting User: Cannot define forecasts, objects or algorithms. Cannot edit actuals or historical forecast values.
- Can enter forecast values for opportunities, orders and subscriptions
Subscription Forecasting User Edit Historical Values: Same as subscription forecasting user and permission to also edit historical forecast values.
- Same as user
- Can edit historical forecast values for previous months in current fiscal year
Subscription Forecasting Automated Only User: Cannot define forecasts, objects or algorithms. Can not enter forecast values manually, edit actuals or historical forecast values.
- Read only pages
- Enables automated forecasting driven from changes made to opportunities and orders
In addition to the above user permission sets the following add-on permission sets can be added to give users additional permissions.
Subscription Forecast Edit Actuals: Added to user who should be able to edit actuals values.
- Can enter actuals values for opportunities, orders and subscriptions
The application allows you to define your own revenue types as forecast objects and algorithms to distribute revenue over time.
Forecasts
The “Default” forecast will be used for all opportunities and orders that are automatically added to a forecast. Only one forecast should be set as default. See further details in automated forecasting section.
 The seasonal variation percentage is applied when opportunities and orders are added to forecasts.
Defining additional forecasts of type “Budget” enables you to easily compare budget vs forecast in reports. You can create “Subscriptions” and add those your Budget forecast as an alternative to the Opportunities/Orders going onto your regular forecast. Detailed step-by-step instructions are found here.
A complete forecast with all its lines can also be copied into a “budget” forecast using the line level button to facilitate “what if ?” scenario plannings.
Forecast Objects
A forecast object represent a revenue type that can be forecasted for opportunities and orders. Each forecast object added to a forecast results in a separate line of values for each opportunity/order.

Examples could be “Cloud Subscription ” Professional Services, “Service Contract”, “Maintenance”, “Application Management”, “Product Segment A”, “Product Segment B” etc.
ALGORITHM ATTRIBUTION % is only relevant for opportunities without product lines. For those, it controls how revenue is spread across forecast objects (as there are no product mapping to steer that).
Examples:

“Cloud Subscription Growth” will get 100% of the amount when opportunities are added to this forecast.

“Cloud Subscription Growth” and “Cloud Subscription “will get 50% of the amount each.
Algorithm attribution values are treated as individual weights. If three forecast objects each having algorithm attribution=50 would be used on a forecast the three corresponding forecast lines would get 1/3 of the amount each (50/150 = 33.33).
SEASONAL VARIATION: is used when opportunities or orders are added to forecasts. The seasonal variation pattern is defined on forecast level.
CODE: used when products and/or product families are mapped to forecast objects.
Algorithms
Algorithms define monthly revenue distribution patterns and control how opportunity and order amounts get distributed over time when added to forecasts.
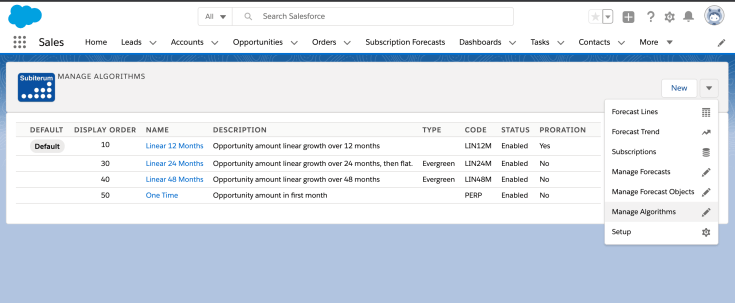
An algorithm defines how monthly percentages of the amount should be applied starting from the opportunity close date / order start date or line level dates if products are being used.
Examples:
An algorithm to implement a “linear 12 month” amount pattern would have 8.33 (100/12=8.33) as the monthly value for each of Period01-Period12.
An algorithm to implement full opportunity amount in the closing month would have 100 in Period01.
Default means this Algorithm will be used when opportunities without products are automatically added to forecast. It will also be used as fallback algorithm for opportunities and orders with products if a product lacks mapping to algorithm. Only one algorithm should be set to default. You need to define at least one algorithm in the system but it can have all 0 values in the event you do not want any values to be populated by your algorithm but instead update values manually for instance for project based revenue.
Proration can be enabled/disabled on algorithm level to control if partial amounts should apply for recurring forecast objects.
- Only Recurring forecast objects (forecast lines) are prorated and Proration only applies for opportunities/orders with product lines
- The opportunity close date/order start date is included in prorated amount i.e. if close date is first day of a month, the full month will be forecasted.
- If the application setting ContractLimitsEnabled has been set to “Yes” proration is also being applied based on contract end date.
- The contract end date is included in the prorated amount i.e. if the contract end date is last day of month, the full month will be forecasted.
Evergreen means that the Algorithm should extend longer than 48 months by re-using Period37-48 percentages for additional years.
Product Based Forecasting
Your Product Families and/or individual Products can be mapped to algorithms (distributing revenue over time) and forecast objects (lines on forecast) to automatically get revenue distributed as appropriate for each product. The video below shows how to map products to different forecast objects and how line level dates can be used to control the revenue distribution over time.

You configure the product mappings on the applications Setup page.
Make sure that your Salesforce product definitions include a Product Code for each product as it is used in the mapping logic (also for product family mappings).
Start and end date control is available both for opportunity and order products. In addition to using the Salesforce standard fields, the application can be configured to use custom end date fields on Order Products and Opportunity Products. See application settings OpportunityItemCustomCancelDateFieldName , OrderItemCustomCancelDateFieldName.
Example:
1. Define a product family for your hardware products and map it to a forecast object for hardware and an algorithm placing full amount in first month.
2. Define a product family for your 12 month subscription products and map it to a 12 months algorithm and a forecast object for subscription revenue.
Result: When products in these families are used on opportunities or orders the respective product line sub totals will automatically show up on different forecasting lines with revenue distributed correctly over time driven from the product family mappings.
The product based mappings have the following characteristics:
Algorithm Mappings
– If a product level mapping is found it takes precedence
– If no product level mapping is found then product family mappings are explored
– If no product or product family mappings are found for algorithm then the “Default” algorithm is used
– If no “Default” algorithm has been defined, the values default to 0
Forecast Object mappings
– If a product level mapping is found it takes precedence
– If no product level mapping is found then product family mappings are explored
– If no product or product family mapping is found for a product it will be ignored
– Product line dates are used when present. Otherwise the opportunity/order start dates are used

Note: Product Code is the basis for the mapping logic. Products must have a product code defined for mapping to work.
Note: The Product Family API name is the basis for mapping. Make sure to use the the API Name in your mappings.

Automated Forecasting
The automation is invoked upon save of Opportunity or Order records and can automatically add//remove Opportunities/Orders from the forecast based on the AutoAddOpportunitesToForecast, AutoAddOpportunitiesThreshold, AutoRemoveOpportunitiesThreshold, AutoAddOrdersToForecast application settings.

When opportunities or orders are added to a forecast their respective close date/start date becomes the initial month from which the algoritm starts applying values. For opportunities without lines, the opportunity amount is the base line for the algorithms. Opportunities and orders with product lines base the logic on the individual line dates and totals.
The seasonal variation pattern defined on forecast level gets applied on the values derived by an algorithm.
When an opportunity or order is updated, changes to opportunity close date, order start date, opportunity/order amount are automatically reflected into the forecasted values.
Examples:
A. Opportunity close date moved to one month later => forecasted values are moved by one month
B. Opportunity amount decreased by 25% => forecasted values reduced by 25%. This percentage based adjustment means any manual adjustments to values remains but adjusted with same percentage as original opportunity amount.
C. Product lines are added/removed/changed on opportunity/order => forecasted values are recalculated.
D. Order start date is updated => forecasted values are recalculated
Forecast rows with only zero values are automatically deleted in the background on daily basis at midnight.
Dashboards and Reporting
The application includes reports and report types to start from when you create dashboard components. The main underlying objects of relevance for reports are:
- Subscription Forecast Line: stores all monthly values for a forecast line in a single record
- Subscription Forecast Line Info: stores forecasted and actual values for a single month
The are suitable for different types of dashboard components including the ones below.

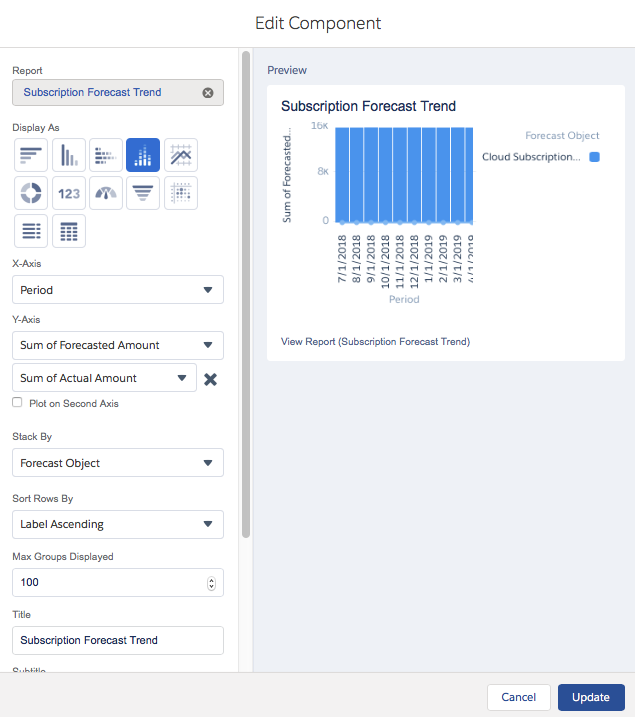
Steps to create the stacked bar chart view at the top above:
- Add a dashboard components to your dashboard.
- Select the “Subscription Forecast Trend” report
- Define dashboard settings like screenshot below
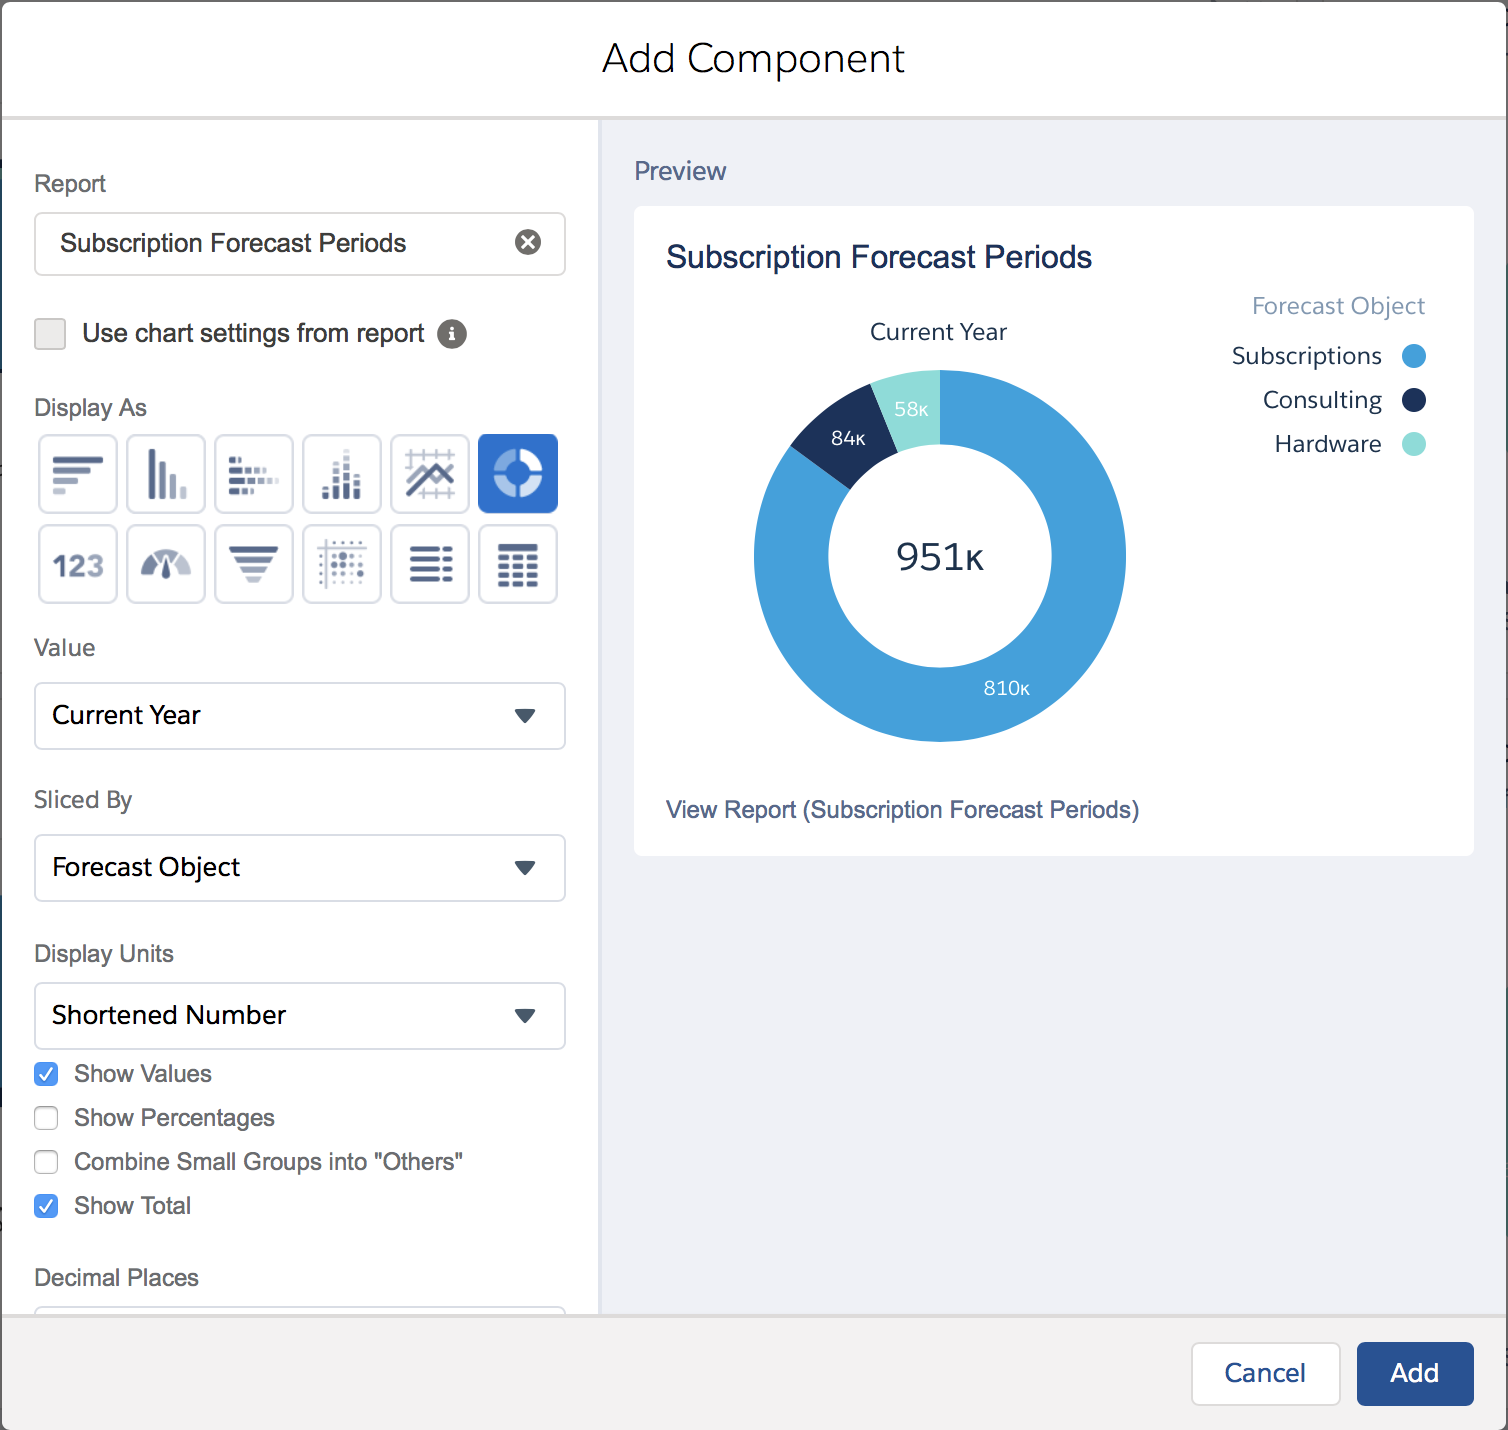
Follow the steps below to create the Subscription Forecast Current Year donut:
- Add a dashboard components to your dashboard.
- Select the “Subscription Forecast Periods” report
- Define dashboard settings like screenshot below
The Subiterum report types contains lookup fields from Opportunity and Order objects for use in reports. To add additional fields, including custom fields, you can “clone” a Subiterum report type into your own and then modify that one based on your needs.
Step-by-step instructions for how to configure and report on Budget vs Forecast vs Actuals can be found here.

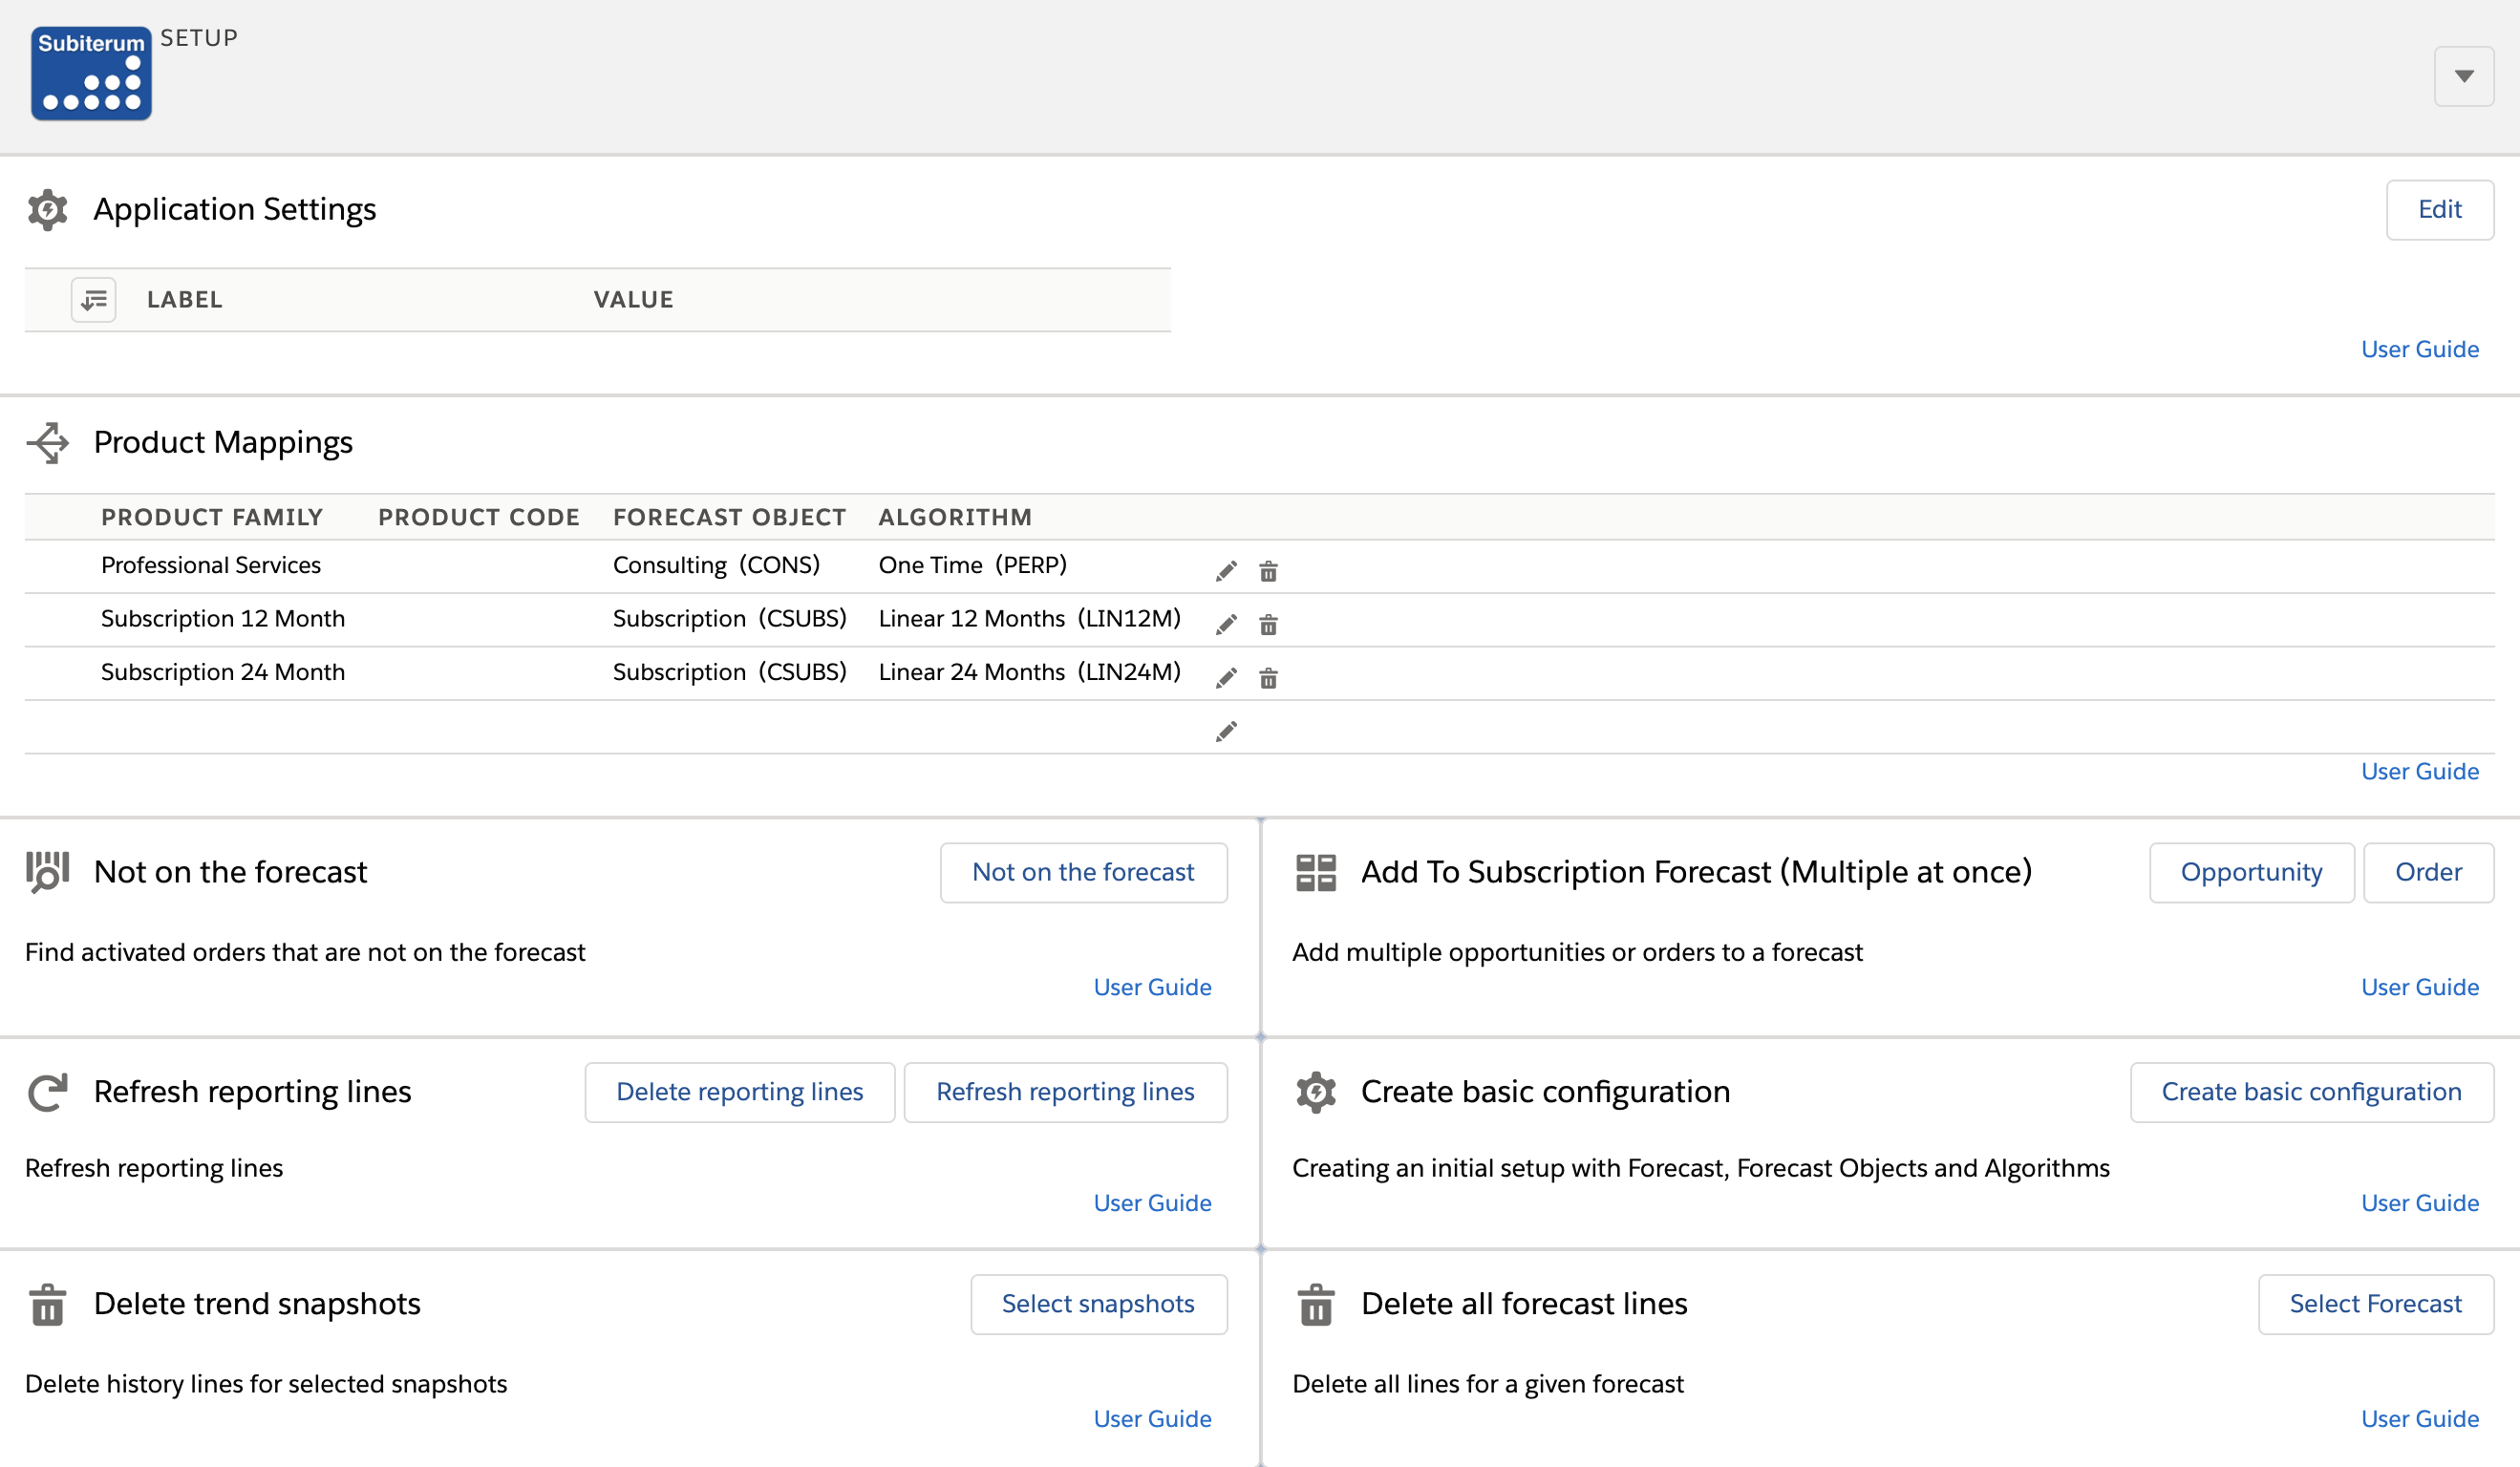
Application Settings and Setup Page
The Setup page is only available for admin users.

- Application Settings to control general capabilities. See next section for details.
- Product Mappings
- Add To Subscription Forecast (Multiple at once): Launch the page for bulk adding Opportunities or Orders to a forecast
- Refresh reporting lines
- Refresh reporting lines
- It does the following:
- deletes all lines in subsfor__SubscriptionForecastlineInfo__c
- forecast lines are not impacted by this, only the lines used by reports and dashboards
- inserts reporting lines from previous-current-next-third-fourth fiscal years
- deletes all lines in subsfor__SubscriptionForecastlineInfo__c
- It does the following:
- Delete reporting lines
- It does the following:
- deletes all lines in subsfor__SubscriptionForecastlineInfo__c
- forecast lines are not impacted by this, only the lines used by reports and dashboards
- deletes all lines in subsfor__SubscriptionForecastlineInfo__c
- It does the following:
- Refresh reporting lines
- Create basic configuration
- Can be used to populate the application with basic configuration data as a fast way of getting started. Basic data can then be modified to fit your needs.
- Not on the forecast
- Launch the page to find any order not on your forecast.
- Useful if you have more than 30 000 lines on your forecast. If you have fewer than 30 000 lines on your forecast you can use the “bulk add order” page to see this instead.

- Refresh: starts an asynchronous job that goes through all orders with non-zero amount activated after the selected date to check if they are on forecast or not. Orders found not to be on the forecast are inserted into the subsfor__SubscriptionForecastNotForecasted__c object.
- The latest 10 000 orders not on forecast are then displayed on this page.
- Launch the page to find any order not on your forecast.
Application Settings
Configured in the Salesforce Custom Metadata Type named “SubscriptionForecastSettings”
- AutoAddOpportunitesToForecast (Yes/No)
- Controls if Opportunities should be automatically added/removed to forecasts when Opportunity. Probability crosses the AutoAddOpportunitiesThreshold.
- AutoAddOpportunitiesThreshold (Default=60)
- When an Opportunity is saved making its Probability % go above this threshold the Opportunity is added to the Default Forecast.
- AutoRemoveOpportunitiesThreshold (Default=40)
- When an Opportunity is deleted or updated making its Probability % pass below this threshold the Opportunity is removed from Forecast.
- AutoAddOrdersToForecast (Yes/No)
- Controls if orders should be automatically added to forecasts when their status gets updated to “Activated”
- ContractLimitsEnabled (Yes/No)
- Controls if contract end date should be taken into consideration when values are created from algorithms.
- DisplayActuals (Yes/No)
- Controls if all users should be able to expand to show Actuals in Forecast Line UI

- EnableLineInfoReporting (Yes/No)
- Controls if forecasting data should be duplicated into the subsfor__SubscriptionForecastLineInfo__c object to simplify creation of certain reports (SubscriptionForecastTrend). This setting can be used for turning off data population into this object which saves a significant amount of storage in your salesforce organization.
- EnableSubscriptions (Yes/No)
- Controls if the Subscriptions menu option should be visible in the application.
- FormatDisplay
- Defines the format used for values displayed on the forecast line page.
- Example for 0 decimals displayed: ###,##0
- Example for 1 decimals displayed: ###,##0.0
- Example for 2 decimals displayed: ###,##0.00
- FormatInput
- Defines the format used by input fields on the forecast line page.
- Example for 0 decimals displayed: ###,##0
- Example for 1 decimals displayed: ###,##0.0
- Example for 2 decimals displayed: ###,##0.00
- HistorySnapshotPolicy (Yearly/Monthly/Weekly)
- Controls how often history snapshots are taken of your forecast lines.
- Snapshots are taken 00:00 in your corporate timezone
- Yearly: snapshot taken when shifting to new fiscal year
- Monthly: snapshots taken the 1st day of every month
- Weekly: weekly snapshots taken
- Automatically deleted when they get older than 1 months after which only the first one in every months is kept
- You can configure what day you want snapshots taken by using the following pattern: WeeklyMonday, WeeklyTuesday…
- Controls how often history snapshots are taken of your forecast lines.
- LoadAllForecastLines (Yes/No)
- Controls if all lines visible for a user get loaded into the line and trend pages or if lines are loaded owner by owner. Set this setting to No if you have large volumes.
- NumberOfVisibleFiscalYears (Default=2)
- Controls how many fiscal years that are visible in UIs. Valid values are 1-4.
- OrderLabel (Default=Order)
- Controls the label displayed for orders added to a forecast
- Order: the order number is displayed
- Account: the account name is displayed
- Both: both account name and order number is displayed
- Controls the label displayed for orders added to a forecast
- PageSettingsForecastLine (Default=1111)
- Controls which summary lines that are visible on the forecast line page.
- 1 = line visible
- 0 = line hidden
- Each position represents a summary line from top to botton. Examples:
- 0111 = Sum* line hidden
- 1011 = ARR* line hidden
- Controls which summary lines that are visible on the forecast line page.
- PaginationForecastLine (Default=10)
- Controls number of lines shown per page on the Forecast Line page
- PaginationSubscription (Default=10)
- Controls number of lines shown per page on the Subscriptions page
- TrendThresholdGreen (Default=10)
- Forecast Trend UI: Green highlighting threshold. 10 means that all current period summaries with >10% increase than previous period summaries gets highlighted in green.
- TrendThresholdRed (Default=10)
- Forecast Trend UI: Red highlighting threshold. 10 means that all current period summaries with <10% decrease from previous period gets highlighted in red.
- UpdateOpportunityAmountFromLine (Yes/No)
- Controls if Opportunity amount can be updated from Forecast Line UI for opportunities without product lines.
- UpdateOpportunityAmountFromLineYears (1-5, default=4)
- Number of years included when forecasted values are summarised to update Opportunity Amounts.
- 1 year means 12 months from Opportunity Close Date
- 5 years means all forecast periods from Opportunity Close Date
- For opportunities with a close date earlier than current fiscal year the start date of current fiscal year is used.
- Number of years included when forecasted values are summarised to update Opportunity Amounts.
Custom Application Settings. In addition to the above standard application settings you can add the following ones for by using the “New” button. See this video for how to configure and enable them.
- OpportunityCustomStartDateFieldName
- Specify your own custom field to be used as start date on Opportunity level
- When updated: forecast values are recalculated using the default algorithm and the default forecast object
- Ignored for opportunities with products
- Specify your own custom field to be used as start date on Opportunity level
- OpportunityCustomEndDateFieldName
- Specify your own custom field to be used as end date on Opportunity level
- When start date is populated it overrides opportunity close date
- When updated: forecast values are recalculated using the default algorithm and the default forecast object
- Ignored for opportunities with products (use OpportunityItemCustomCancelDateFieldName)
- Specify your own custom field to be used as end date on Opportunity level
- OpportunityCustomAmountFieldName
- Specify your own custom field to be used instead of Opportunity Amount
-
- Add this record to the SubscriptionForecastSettings Custom Metadata Type
- Label: OpportunityCustomAmountFieldName
- Value: [your field name]
- Add this record to the SubscriptionForecastSettings Custom Metadata Type
-
- Specify your own custom field to be used instead of Opportunity Amount
- OpportunityItemCustomCancelDateFieldName
- Specify your own custom end date field on Opportunity Product (OpportunityLineItem) level. Add this record to the SubscriptionForecastSettings Custom Metadata Type
- Label: OpportunityItemCustomCancelDateFieldName
- Value: [your field name]
- Specify your own custom end date field on Opportunity Product (OpportunityLineItem) level. Add this record to the SubscriptionForecastSettings Custom Metadata Type
- OpportunityItemCustomTotalPriceFieldName
- Use your own custom TotalPrice field on Opportunity Product (OpportunityLineItem) level. Add this record to the SubscriptionForecastSettings Custom Metadata Type
- Label: OpportunityItemCustomTotalPriceFieldName
- Value: [your field name]
- Use your own custom TotalPrice field on Opportunity Product (OpportunityLineItem) level. Add this record to the SubscriptionForecastSettings Custom Metadata Type
- OrderItemCustomTotalPriceFieldName
- Use your own custom TotalPrice field on Order Product (OrderItem) level. Add this record to the SubscriptionForecastSettings Custom Metadata Type
- Label: OrderItemCustomTotalPriceFieldName
- Value: [your field name]
- Use your own custom TotalPrice field on Order Product (OrderItem) level. Add this record to the SubscriptionForecastSettings Custom Metadata Type
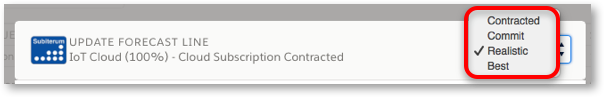
SubscriptionForecastConfidenceList
- Controls which confidence levels that are enabled for selection in the update forecast line popup, their label and display order.
- Enable/Disable the four selections to fit your needs
SubscriptionForecastAdjValListFixed
- Controls the values available in the tools section of the update forecast line popup. Add, remove, change records to implement the values suitable for your business.

SubscriptionForecastAdjValListPercent
- Controls the values available in the tools section of the update forecast line popup. Add, remove, change records to implement the values suitable for your business.

SubscriptionForecastMapping (Deprecated)
Mappings from Products and Product Families to Forecast Objects and Algorithms. Mappings can now be done inside Subiterum instead. If no mapping is defined inside Subiterum then, and only then, are mappings in this custom meta data type used.
Note: Mappings are case sensitive.
Others
Fiscal Years
The application leverage the fiscal year settings of your organisation. Your fiscal year start month becomes the first subscription forecast period. If you update you fiscal year settings the subscription forecasting data will not automatically follow that update. The period headers (JAN, FEB…) will change based on your fiscal year settings but the data in the respective column will not move or change.
This means no data gets lost if you change your fiscal year but also that you need to adjust your data accordingly in the subsfor__SubscriptionForecastLine__c and subsfor__SubscriptionForecastHistoryLine__c objects.
Multi-currency
All forecasted values are stored in the corporate currency. Amounts in other currencies are converted into corporate currency when values are created/updated on forecasts.
Error log
If the application encounters an exception that can not be surfaced without interrupting standard salesforce functionality the error is logged and displayed on the Setup page. Please send us a mail if this happens.
Un-Install Application
- Remove any permission set assigned to your users (in post-installation step 1)
- Navigate: ADMINISTRATION => Users => Permission Sets and click on the permission sets (Subscription Forecasting Admin)
- Click on “Manage Assignments” and then “Remove Assignment”
- Navigate Setup => Apps => Installed Packages and then click “Uninstall”
